Broker Insights
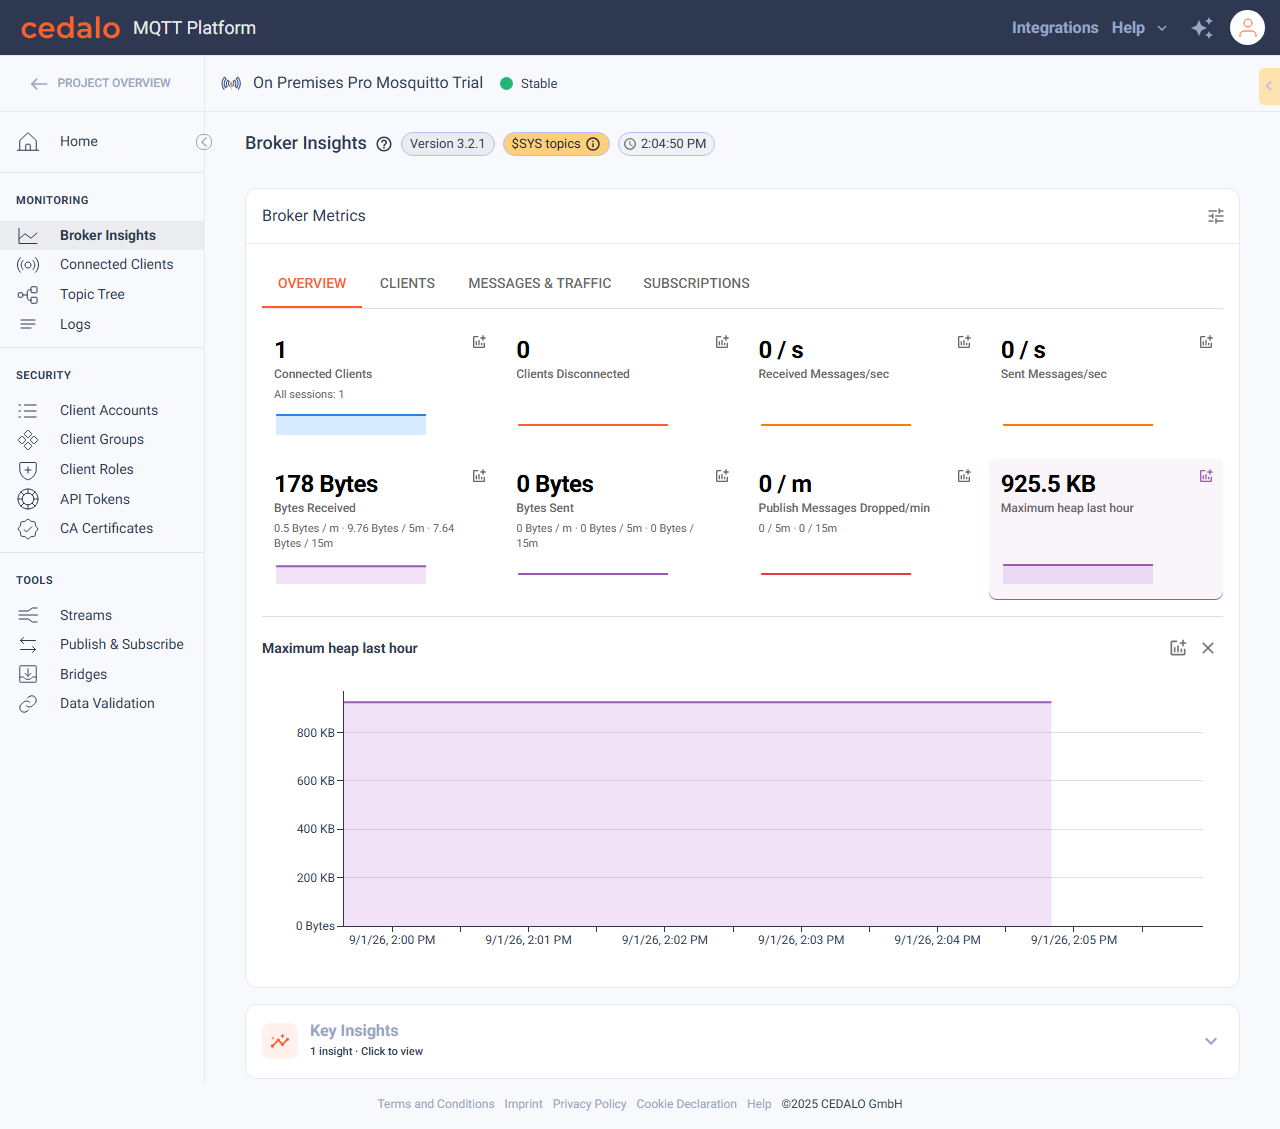
Broker Insights is the metrics dashboard for a broker. It shows live and historical statistics such as connected clients, message rates, and traffic. Open it from the broker sidebar under MONITORING.
Open Broker Insights
- Open a project, then open a broker.
- In the broker sidebar, click Broker Insights.
The page title is Broker Insights. The main section is Broker Metrics, with metric cards grouped by category.
The header may also show broker version, metric source (Prometheus or $SYS topics), and last data update. See Metric sources.
Metric sources
Broker Insights reads live values and history from one of two sources. The active source appears as a chip next to the page title.
| Source in the header | When it is used | What you can see |
|---|---|---|
| Prometheus | Prometheus is configured and currently scrapes this broker (or cluster node). | Full metric catalog for the broker version, including process metrics (open file descriptors, resident memory, and similar). Sparklines and charts can use 1 hour, 24 hours, or 7 days. |
| $SYS topics | Prometheus is not scraping this broker, is not configured, or has no data for it. The platform then uses the broker’s $SYS/# topics from the live management connection. | Only metrics that Mosquitto publishes on $SYS. Process exporter metrics and other Prometheus-only series are hidden. History is the roughly one hour the platform keeps in memory, so the period toggle is hidden and charts stay on 1 hour. |
When the source is $SYS topics, the chip includes an info icon. The tooltip explains that the source is not Prometheus, so some metrics are unavailable and are not displayed.
The same filter applies on Select Metrics: you only see metrics this broker version and this source can provide. A selection you saved while using Prometheus is still stored, but cards that the current source cannot serve stay off the dashboard until Prometheus is available again.
On deployments where you can manage broker settings, display options may also include Prometheus Settings. Use that page to configure how Prometheus scrapes this broker. Cloud brokers do not show that link. See Prometheus.
Metric categories
When more than one category is visible, tabs let you switch groups, for example:
| Tab | Typical metrics |
|---|---|
| Overview | Selected overview cards |
| Clients | Connected clients and related metrics |
| Messages & Traffic | Packet rates, bytes sent/received |
| Other categories | Subscriptions, process, and more |
Click a tab to show that category’s metric cards.
Chart period
When the metric source is Prometheus, use the period toggle above the metrics (1 hour, 24 hours, 7 days) to set the time window for sparklines and historical charts. Your choice is saved with your user settings.
When the source is $SYS topics, the period toggle is hidden. Charts and sparklines always use the last hour, which is as far as $SYS history goes.
View a historical chart
- Click a metric card (for example Connected Clients).
- A historical chart for that metric appears below the cards.
- To remove a chart, click Unpin chart on the chart section (or use the card’s chart toggle).
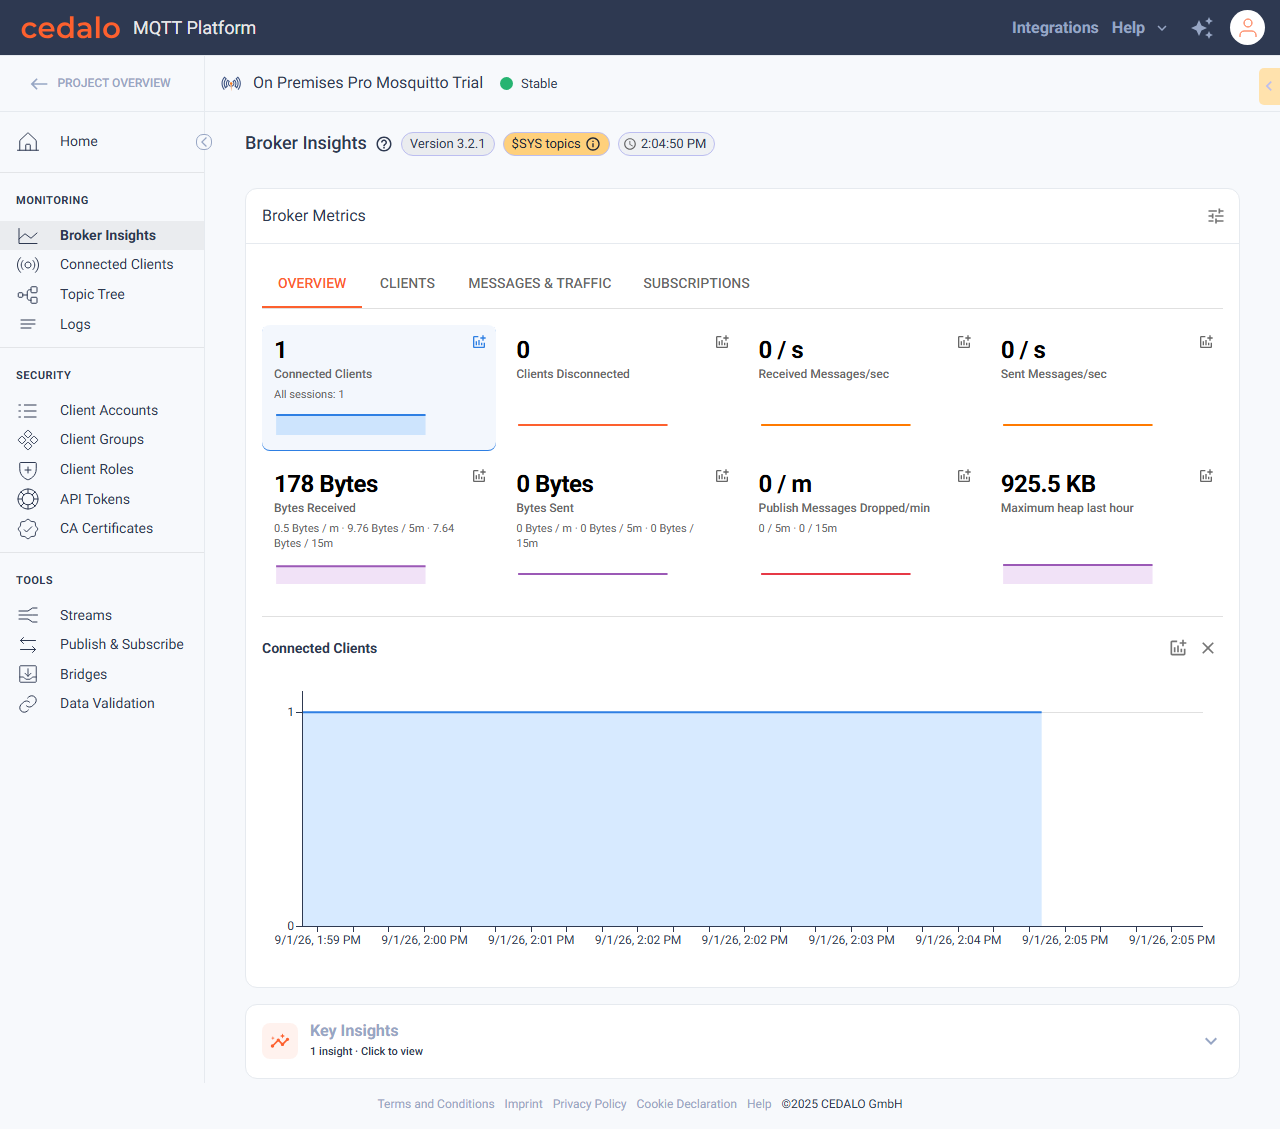
You can add more than one chart from different cards to compare metrics.
Display options
Open the display options control (tune icon) next to the period toggle.
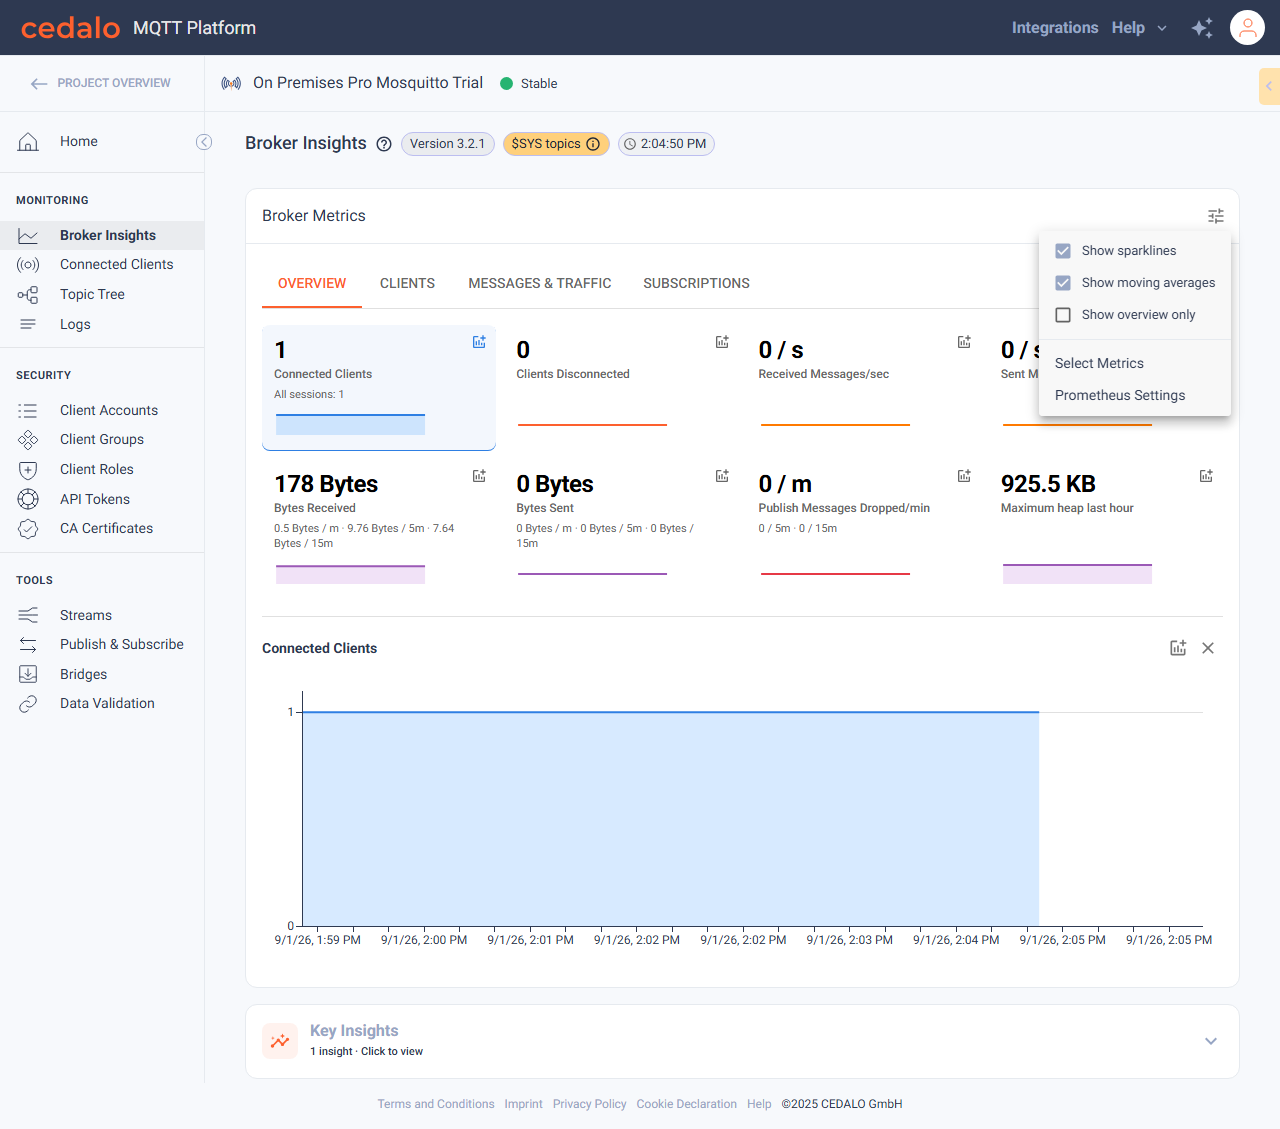
| Option | What it does |
|---|---|
| Show sparklines | Mini trend lines on metric cards |
| Show moving averages | Secondary moving-average values on cards |
| Show overview only | Hides category tabs and shows only Overview cards |
| Select Metrics | Opens the metric selection page |
| Prometheus Settings | Opens scrape settings for this broker (when available) |
Select Metrics
Select Metrics is the editor for which cards appear on Broker Insights, which of them sit on the Overview tab, and how each series is drawn.
Open display options and click Select Metrics.
On the Select Metrics page, review the table. Rows are grouped by category (Clients, Messages & Traffic, and so on). Only metrics available for this broker version and metric source are listed.
For each metric, set:
Column What it does Curve How sparklines and historical charts interpolate the series: Linear, Monotone X, or Step. Visible Whether the metric appears as a card on Broker Insights (in its category tab). Overview Whether the metric also appears on the Overview tab. Turning Overview on also turns Visible on. Changes save as you toggle checkboxes or change Curve. They apply to your user account.
Click Broker Insights (back link or sidebar) to return to the dashboard.
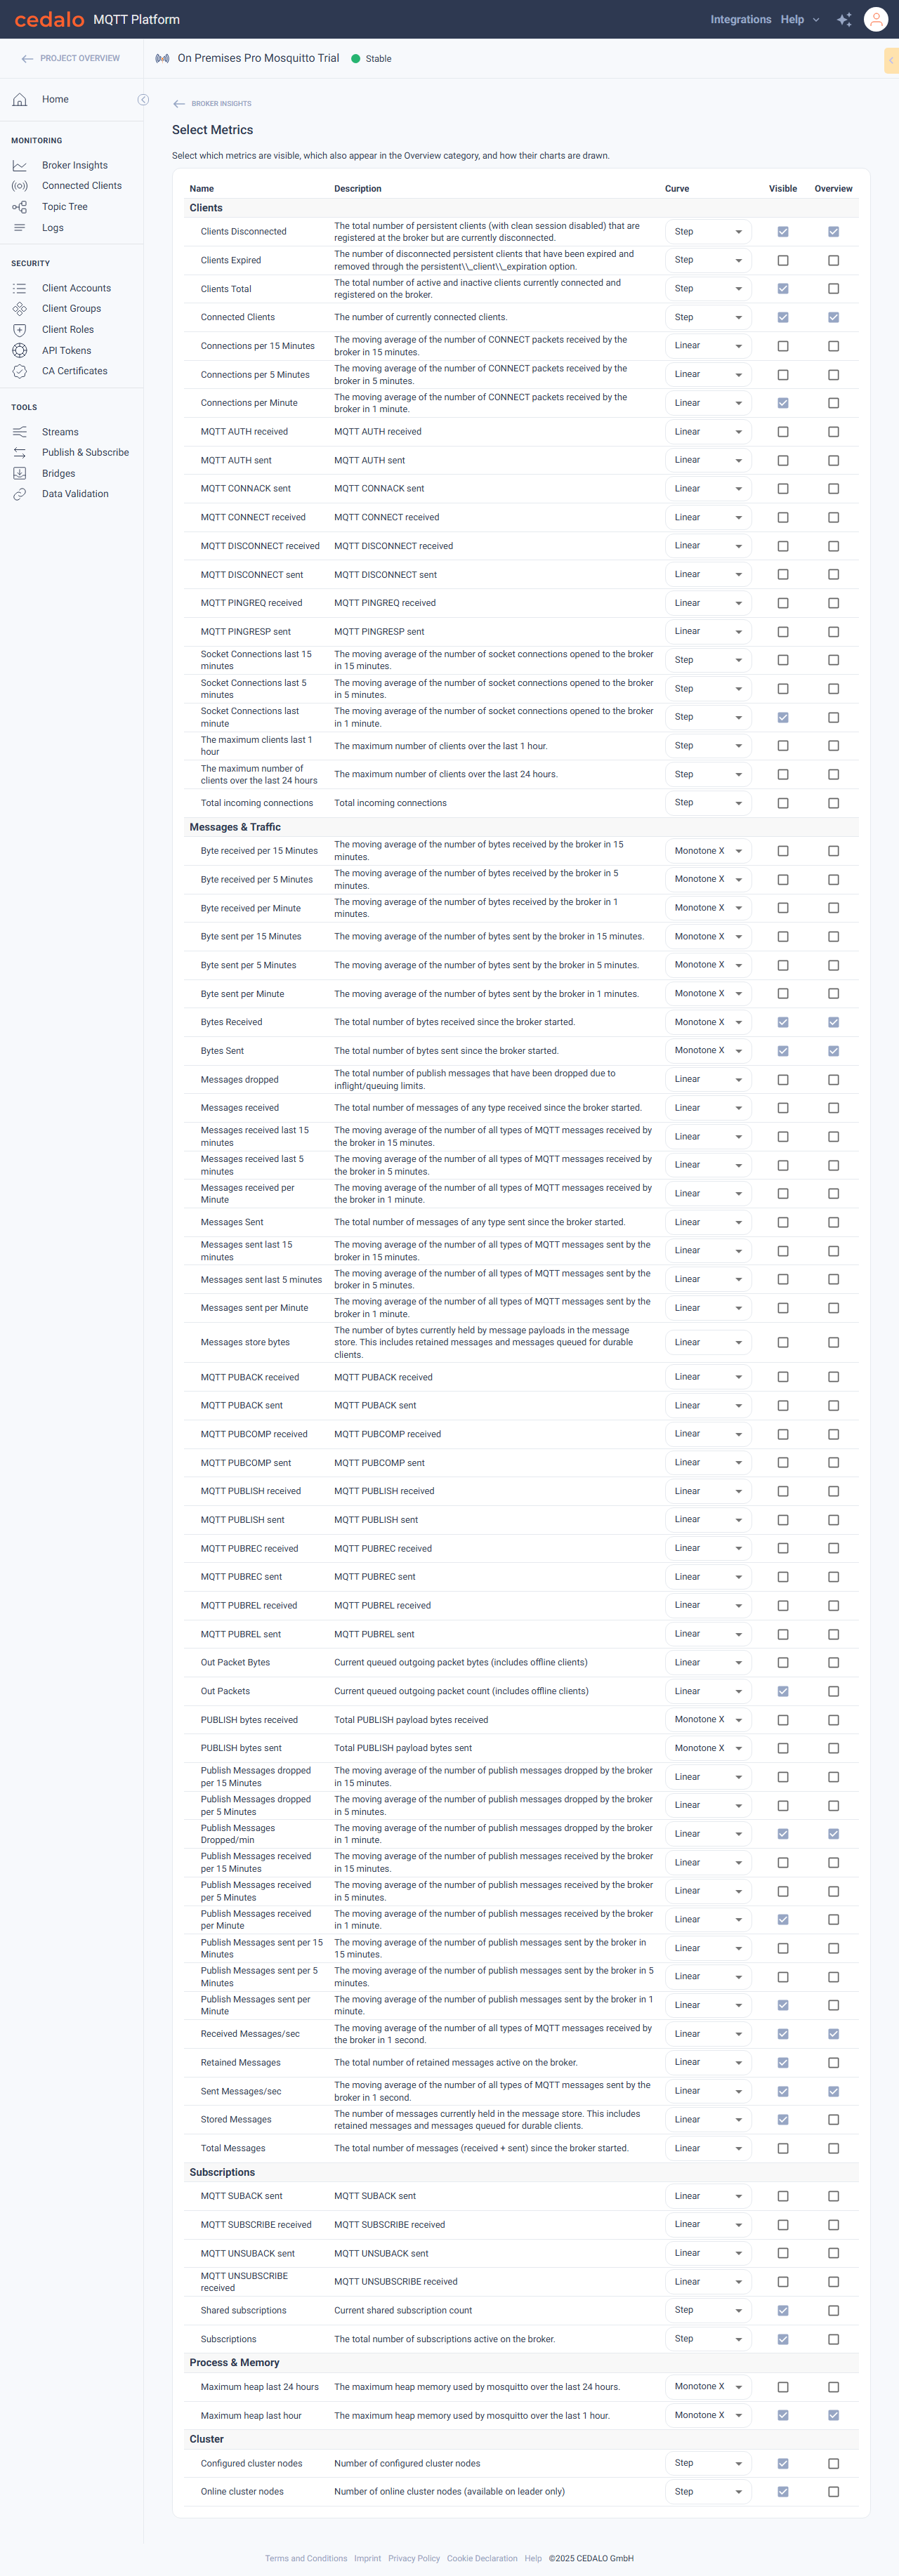
At least one Visible metric is required. If you clear the last visible metric, the platform shows Select at least one metric to display in the overview. and restores the previous selection.
Key Insights
When the broker metrics trigger automatic insights, a Key Insights panel appears below the metrics.
- Click Expand broker insights to open the list.
- Review the insight messages (for example client count or message-rate changes).
- Collapse the panel when finished.
If no insights apply to the current metrics, the panel is hidden.