Prometheus
The Cedalo MQTT Platform queries Prometheus for broker metrics and exposes an HTTP service-discovery endpoint so Prometheus can scrape the Mosquitto Prometheus exporter on each eligible broker.
Configure the integration in two places in the Platform UI:
- Admin Board Prometheus — how the platform queries Prometheus, how Prometheus authenticates when it asks the platform for scrape targets, and the default scheme, port, and path advertised for those targets. Open this page as a root administrator.
- Prometheus Settings — per-broker overrides of scheme, host, port, or path. Open this page from Broker Insights.
Each broker that Prometheus scrapes must enable the exporter in mosquitto.conf:
global_plugin /usr/lib/cedalo_metrics_prometheus.so
For plugin options such as bind address and port, see Prometheus Metrics Exporter.
How the integration works
Three flows make up the integration:
| Flow | Direction | Purpose |
|---|---|---|
| Platform → Prometheus: Query metrics | Platform calls Prometheus | Broker Insights and other metric views |
| Prometheus → Platform: Discover brokers | Prometheus calls the platform | HTTP service discovery of scrape targets |
| Prometheus → Brokers: Scrape metrics | Prometheus calls each broker | Pulls the Mosquitto Prometheus exporter |
Metrics queries run only when a Prometheus URL is set (in Admin Board or with PROMETHEUS_URL). Without a URL the platform stays unconfigured and Broker Insights can fall back to $SYS topics.
Admin Board Prometheus
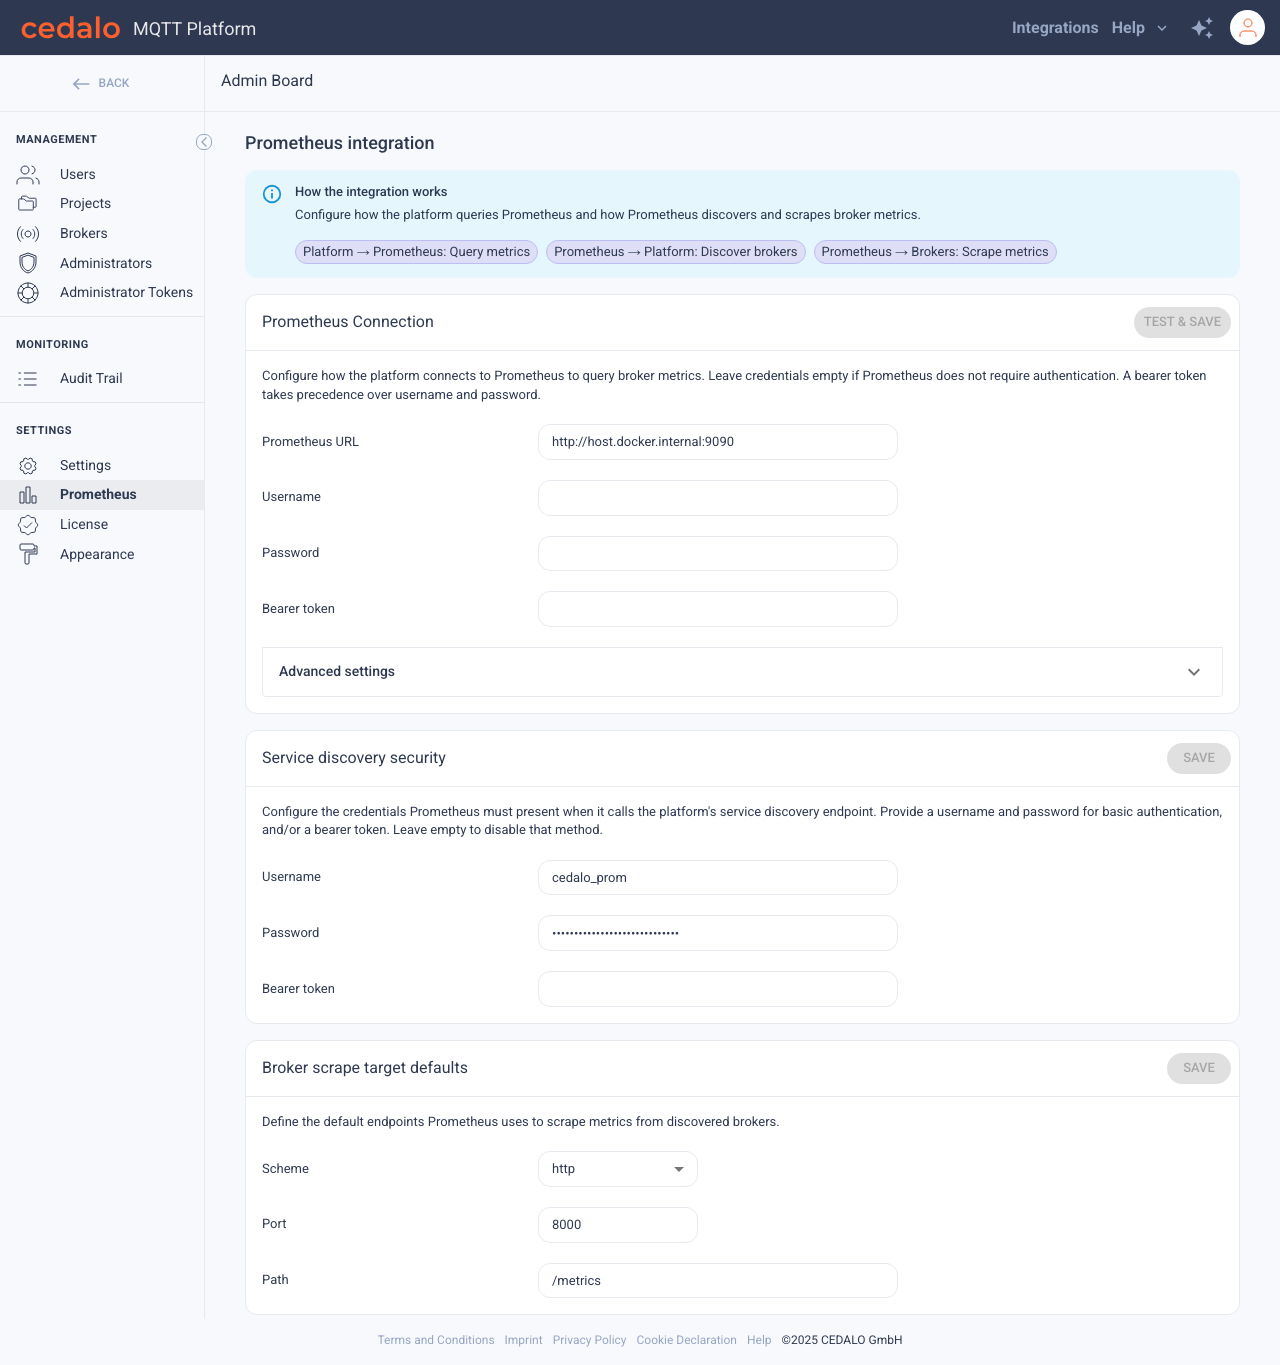
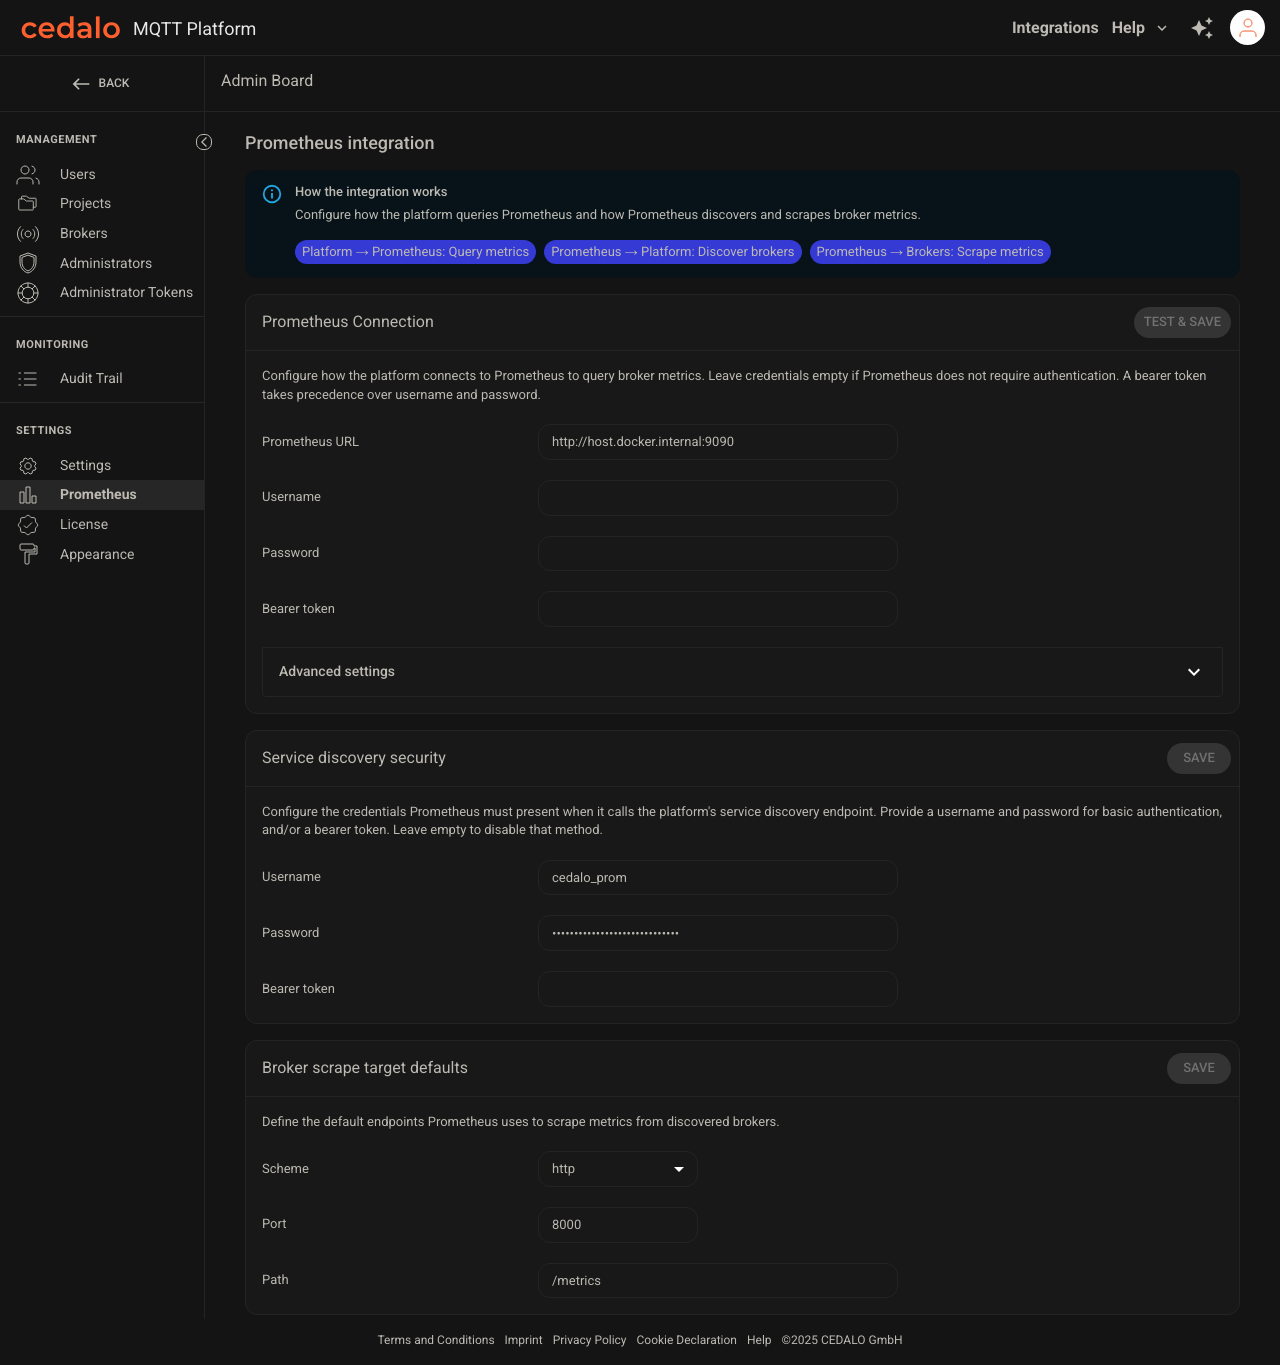
Prometheus is the Admin Board page for the platform-wide Prometheus integration. Use it to set how the platform queries Prometheus for broker metrics, how Prometheus authenticates when it asks the platform for scrape targets, and the default scheme, port, and path advertised for those targets.
Open Admin Board Prometheus
- Click your avatar in the top-right app bar.
- Choose Admin Board.
- In the sidebar, under Settings, click Prometheus.
The page title is Prometheus integration.
Environment variables and Admin Board
Most fields on this page can be configured in two ways:
- An environment variable, which provides a fallback value
- A value saved on this page, which is stored in the platform settings
Values stored in the platform settings take precedence over environment variables and apply without a restart. Saving any section stores the full configuration currently shown on the page, including values that were initially loaded from environment variables. Those stored values continue to take precedence if the environment variables change later.
To return a field to its environment-variable value, clear the field and save the section. If you want to disable an environment-configured credential, also unset its environment variable and restart the platform. For the Prometheus connection, a bearer token takes precedence over a username and password.
Additional environment variables
The legacy token alias has no Admin Board field. Localhost replacement is available in the Admin Board only in non-production builds.
| Environment variable | What it does |
|---|---|
PROMETHEUS_TOKEN | Legacy alias for the connection bearer token. Prefer Bearer token on this page or PROMETHEUS_BEARER_TOKEN. Used only when PROMETHEUS_BEARER_TOKEN is unset. |
PROMETHEUS_SD_TARGET_LOCALHOST_REPLACE | Replaces a scrape host of localhost during service discovery. Shown on this page only in non-production builds. Ignored in production. |
Field to environment variable
| Admin Board field | Environment variable | Default |
|---|---|---|
| Prometheus URL | PROMETHEUS_URL | — |
| Username (connection) | PROMETHEUS_USER | — |
| Password (connection) | PROMETHEUS_PASSWORD | — |
| Bearer token (connection) | PROMETHEUS_BEARER_TOKEN | — |
| Query timeout (ms) | PROMETHEUS_QUERY_TIMEOUT_MS | 10000 |
| Cache TTL (ms) | PROMETHEUS_CACHE_TTL_MS | 10000 |
| Username (discovery) | PROMETHEUS_SD_USER | — |
| Password (discovery) | PROMETHEUS_SD_PASSWORD | — |
| Bearer token (discovery) | PROMETHEUS_SD_TOKEN | — |
| Scheme | PROMETHEUS_SD_TARGET_DEF_SCHEME | http |
| Port | PROMETHEUS_SD_TARGET_DEF_PORT | 8000 |
| Path | PROMETHEUS_SD_TARGET_DEF_PATH | /metrics |
Prometheus connection
This section controls how the platform connects to Prometheus to query metrics.
| Field | What it does |
|---|---|
| Prometheus URL | Base URL of Prometheus (for example http://prometheus:9090). Required for queries. |
| Username / Password | Basic authentication to Prometheus. |
| Bearer token | Token authentication to Prometheus. Takes precedence over username and password. |
- Enter the URL and any credentials Prometheus requires.
- Click Test & save. The platform tries the connection, then stores the section.
- If the test fails, you can Save anyway or Cancel.
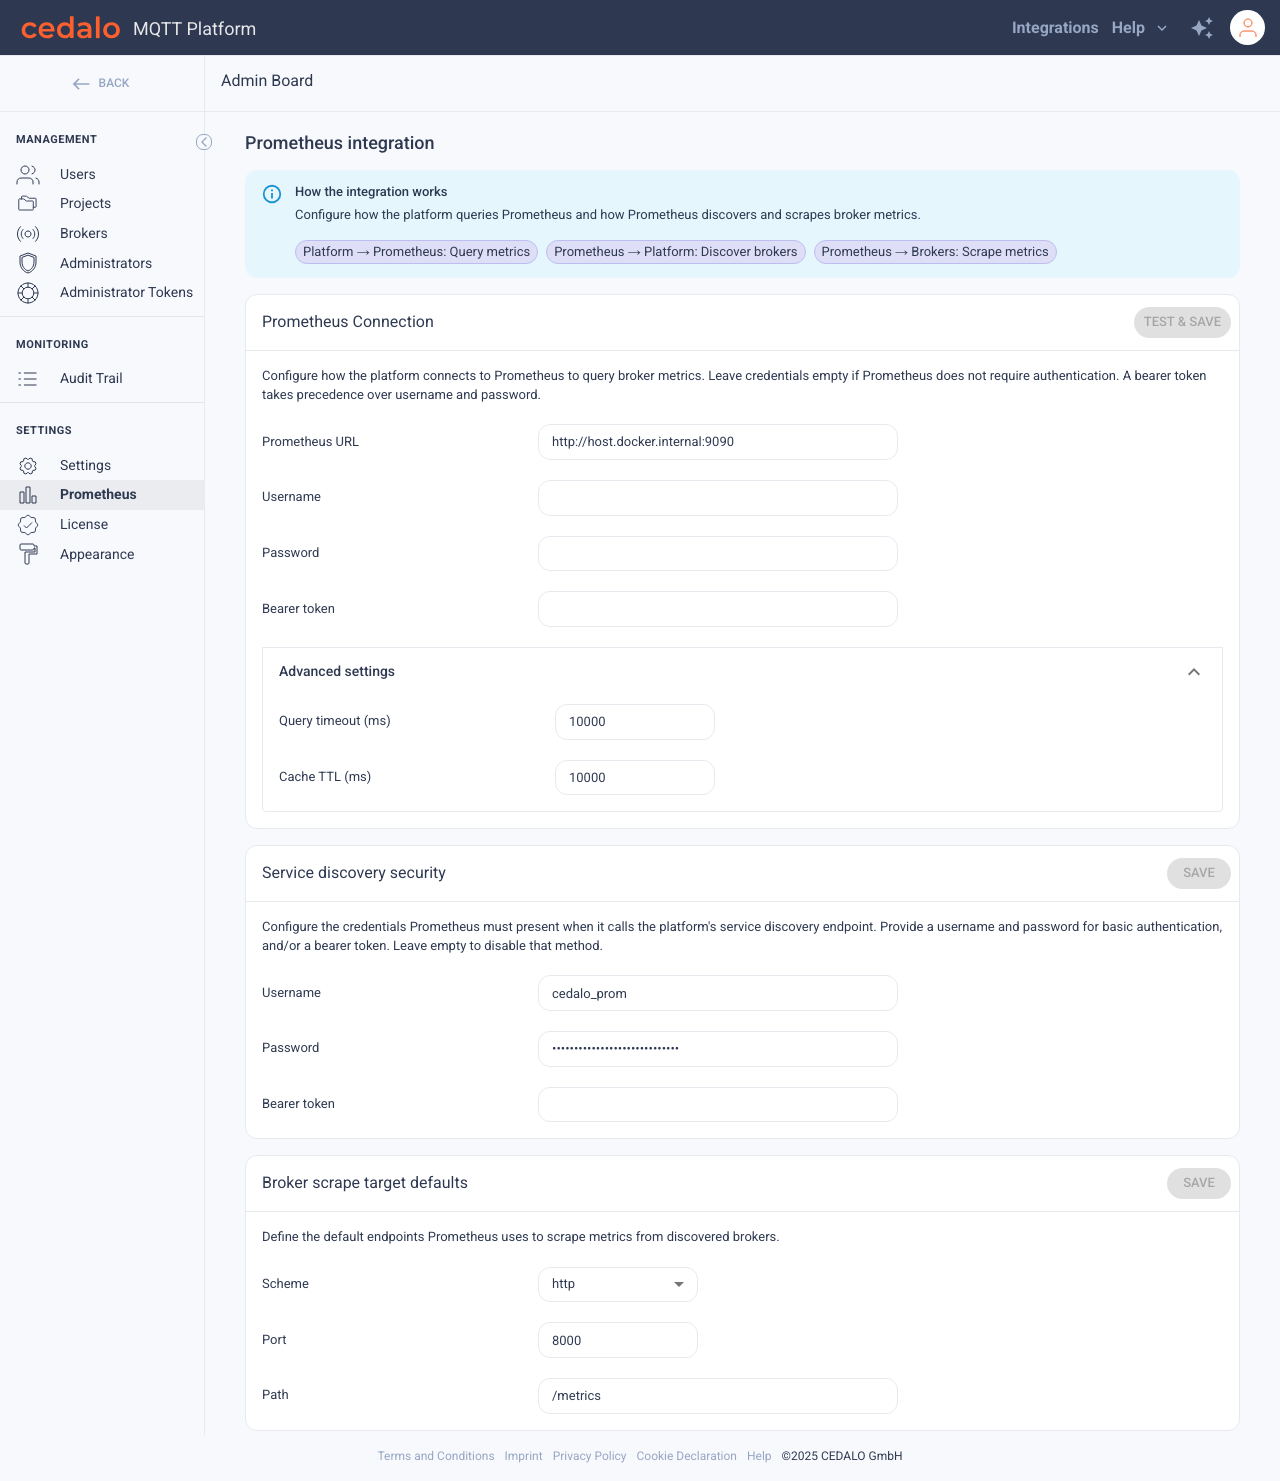
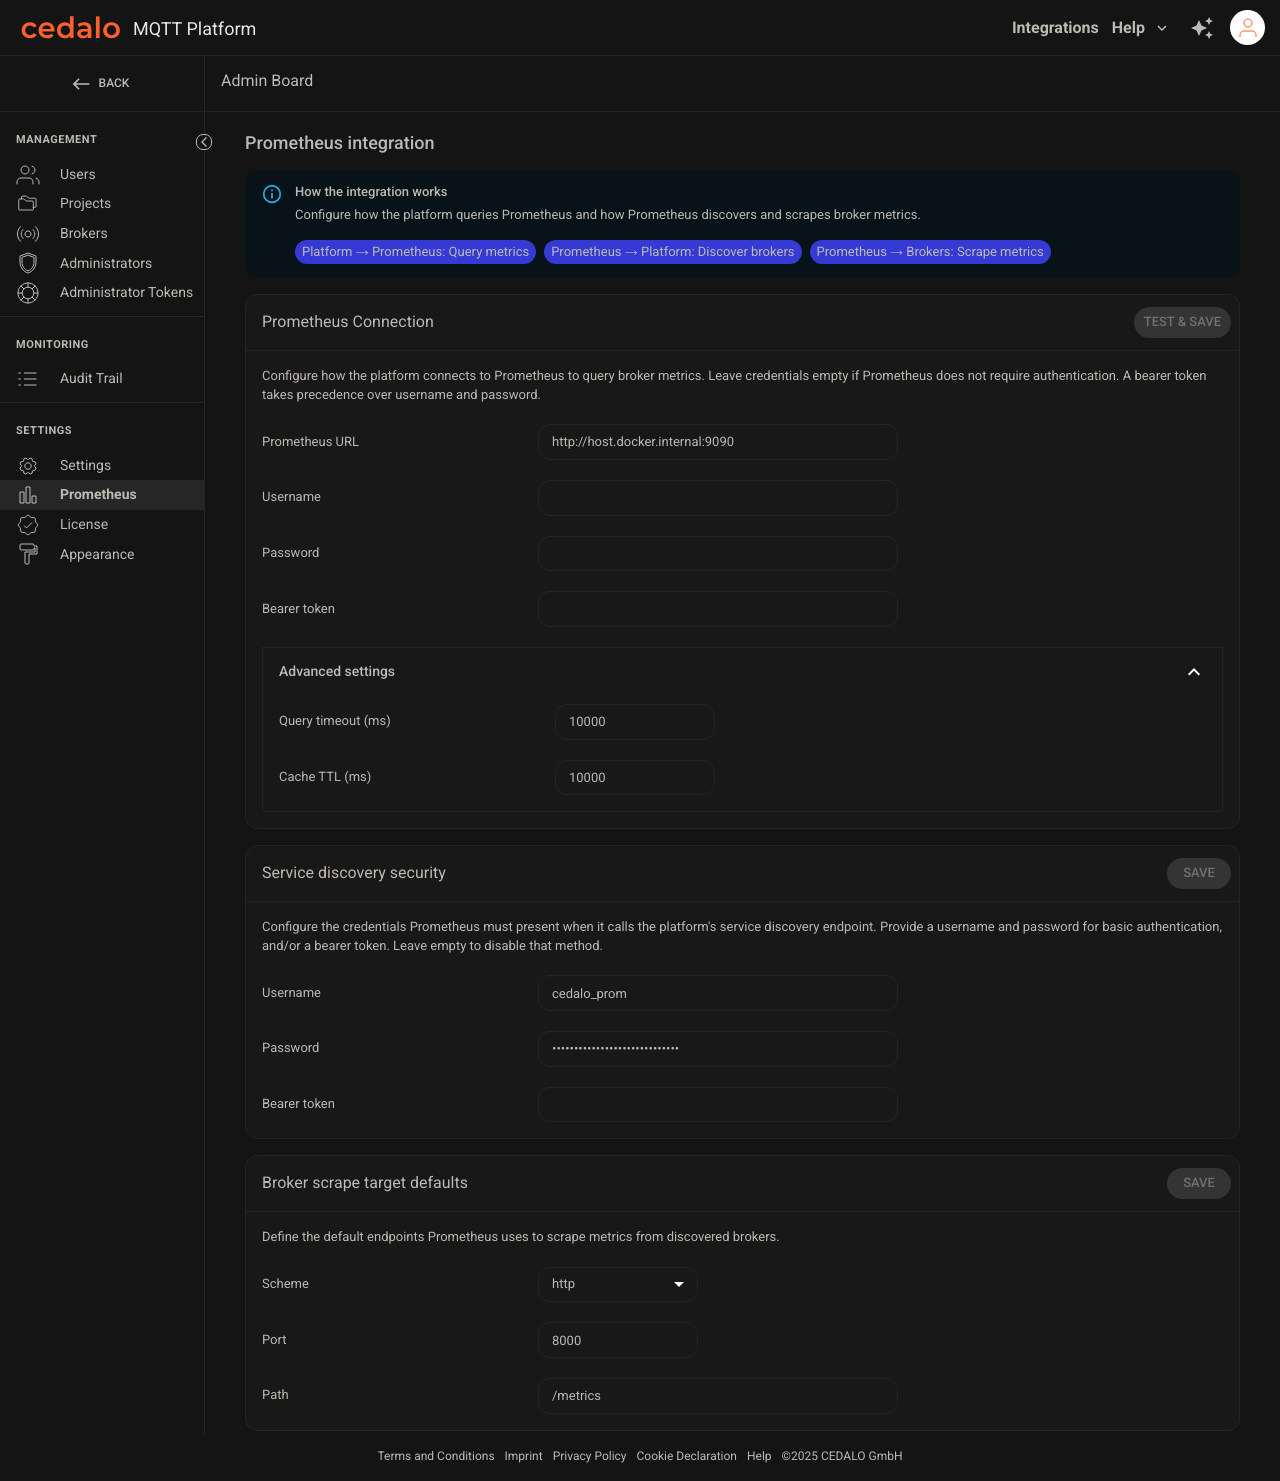
Advanced settings
Expand Advanced settings for query timing.
| Field | What it does |
|---|---|
| Query timeout (ms) | How long the platform waits for a Prometheus query. |
| Cache TTL (ms) | How long the platform reuses a query result. |
Service discovery security
Prometheus calls the platform HTTP service-discovery endpoint to learn which brokers to scrape. The endpoint is /api/prometheus/discovery/mosquitto under the platform base path—for example, /mqtt-platform/api/prometheus/discovery/mosquitto.
Point Prometheus http_sd_configs at that URL. Configure either a username and password for basic authentication, a bearer token, or both. Prometheus must send credentials for one of the configured methods. If neither method is configured, the endpoint rejects all requests.
Clearing a field disables that method only when its corresponding environment variable is also unset. Platform user sessions and application tokens are not accepted here.
| Field | What it does |
|---|---|
| Username / Password | Basic auth for the discovery endpoint. |
| Bearer token | Alternative discovery auth. |
Click Save on this section after you change discovery credentials.
Broker scrape target defaults
These are the global scheme, port, and path Prometheus uses when it scrapes a discovered broker. Override them for a specific broker in Prometheus Settings.
| Field | What it does |
|---|---|
| Scheme | http or https for the scrape URL. |
| Port | Exporter port (default 8000). |
| Path | Metrics path (default /metrics). |
On non-production builds, Localhost replacement also appears. It rewrites a discovered host of localhost (for example to host.docker.internal). You can set the same value with PROMETHEUS_SD_TARGET_LOCALHOST_REPLACE. Production builds hide the field and ignore the replacement.
Click Save on this section after you change defaults.
These defaults do not change how the platform queries Prometheus. They only change the scrape targets advertised during service discovery.
Prometheus Settings
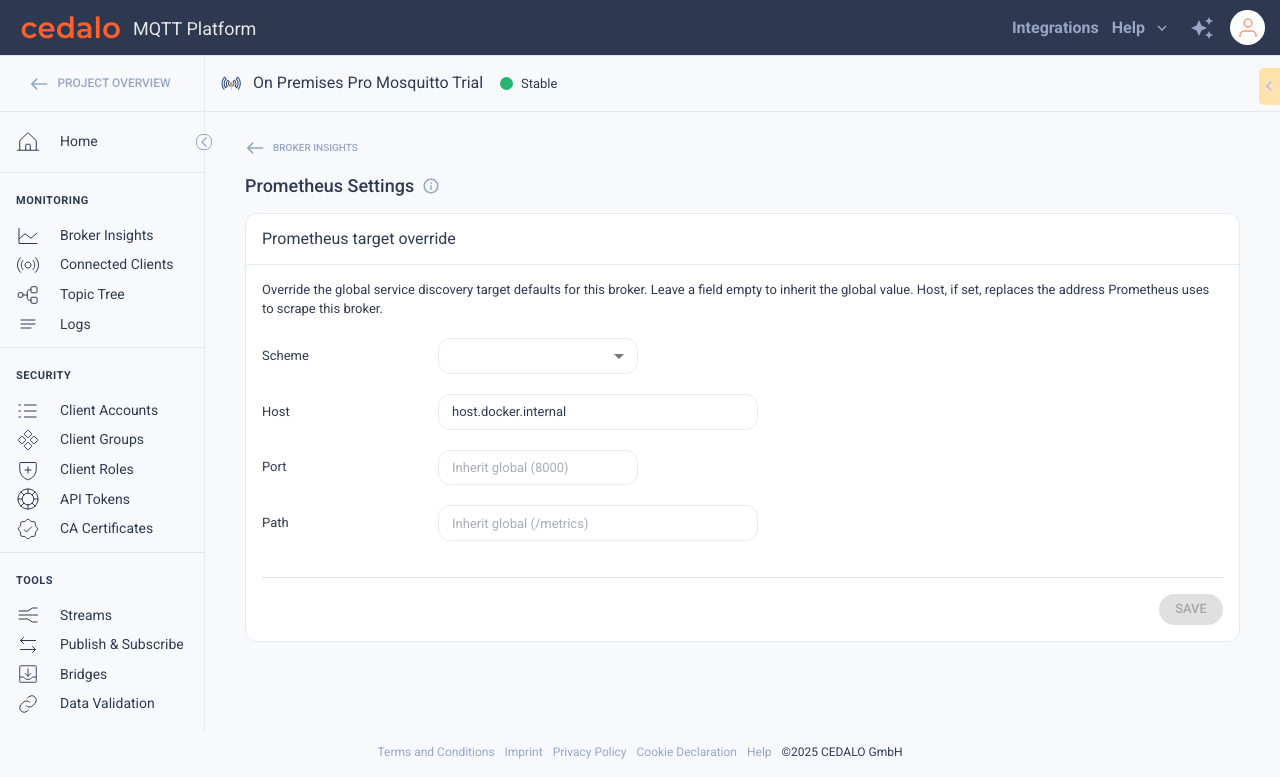
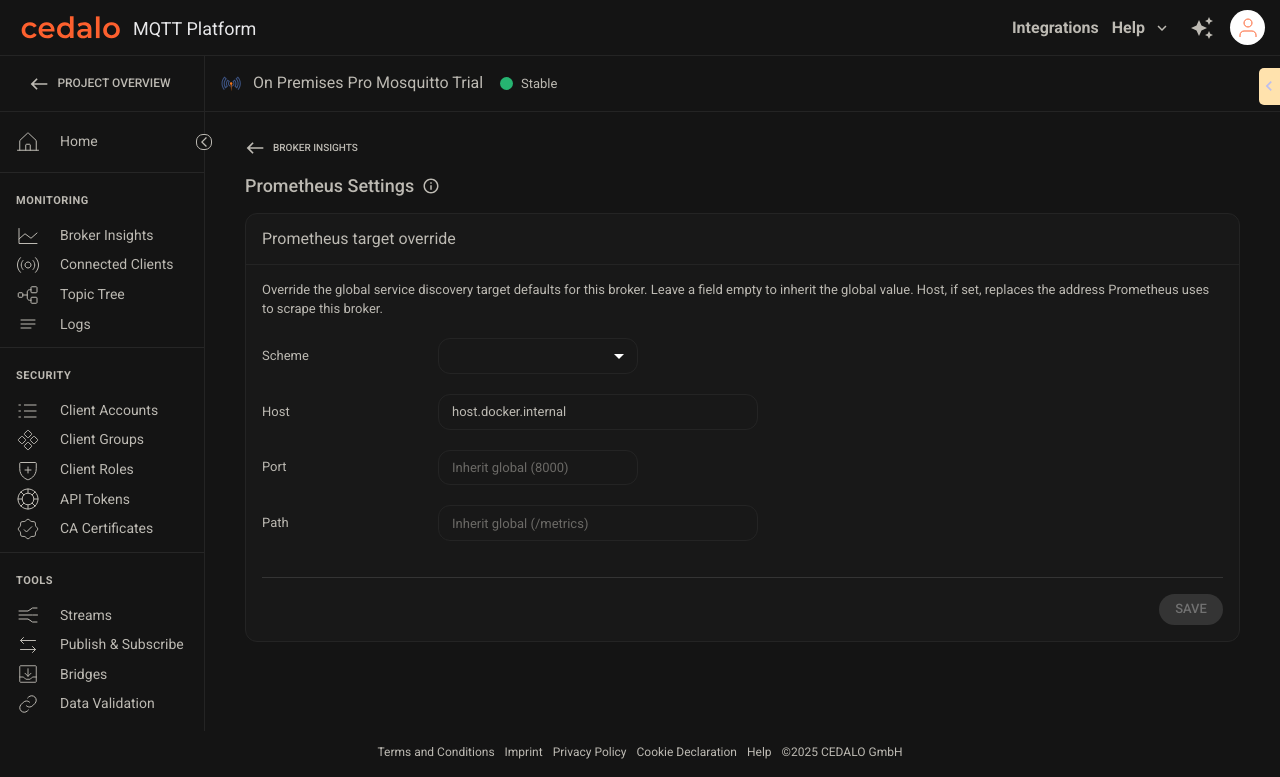
Use Prometheus Settings to override the scheme, host, port, or path that Prometheus uses to scrape this broker. Open the page from Broker Insights rather than the broker sidebar.
Leave a field empty to inherit its global value from Admin Board Prometheus.
Open from Broker Insights
- Open a project, then open a broker.
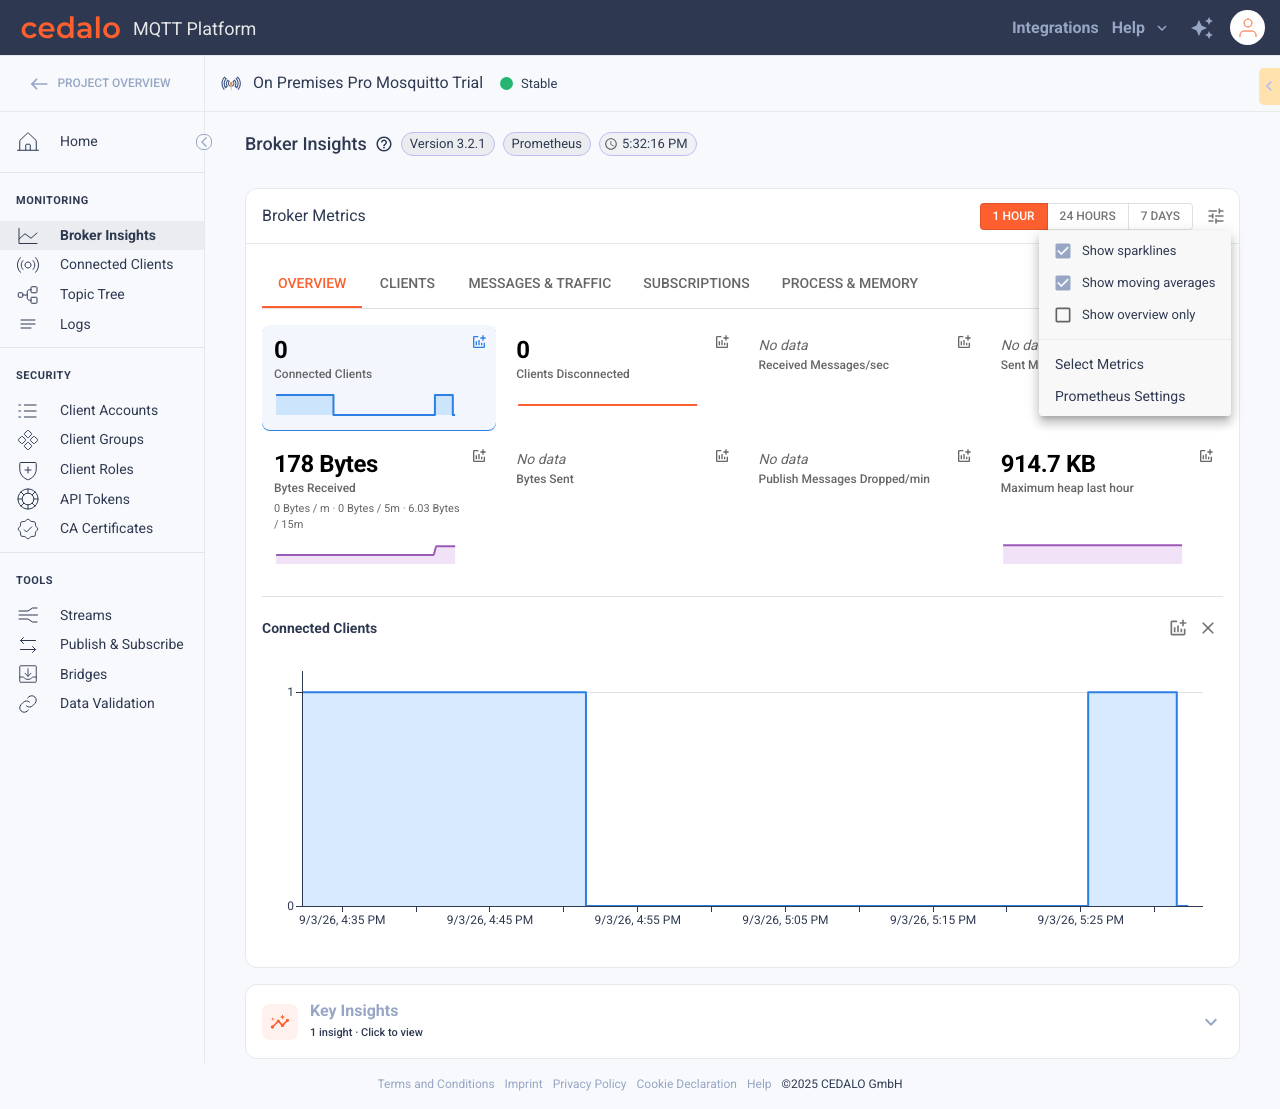
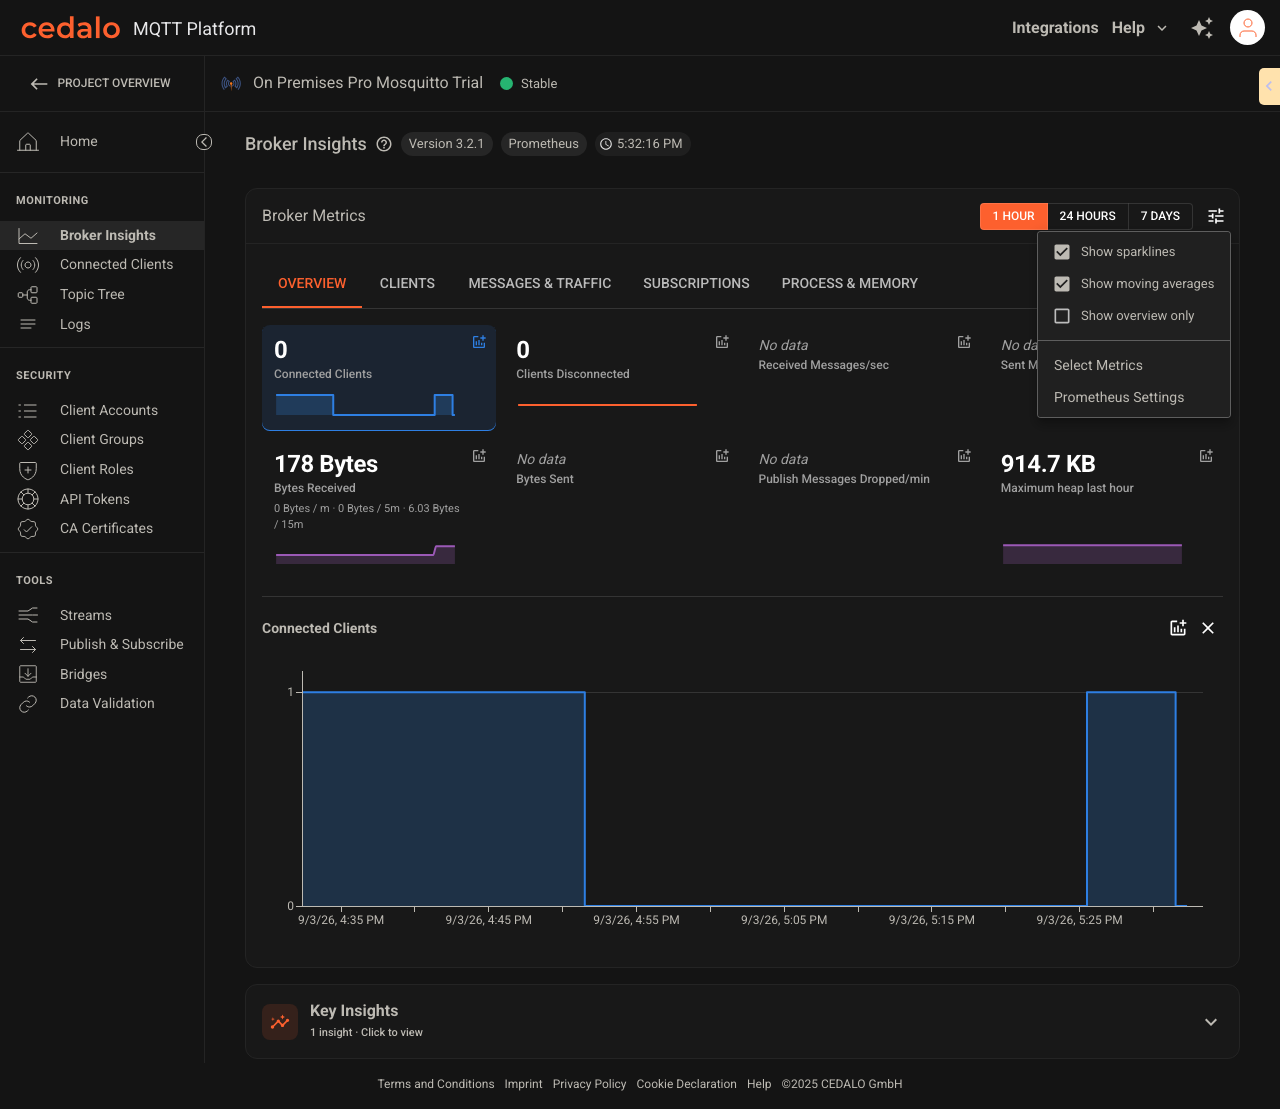
- In the broker sidebar, under MONITORING, click Broker Insights.
- Open the display options control (tune icon) next to the period toggle.
- Click Prometheus Settings.
When Prometheus Settings is available
Prometheus Settings appears in display options only when all of these are true:
- You are using a non-cloud deployment
- You can manage project settings (owner or admin)
- The broker is an instance, not an on-premises setup placeholder
- The broker plan includes Prometheus (trial, enterprise, or XL)
If the link is unavailable, Broker Insights can still use metrics from $SYS topics. See Metric sources.
Override scrape target
For a standalone broker, the form is called Prometheus target override. For a High Performance cluster, the first form is called Cluster defaults. Leave a field empty to inherit its global value from Admin Board. The placeholder shows the inherited value—for example, Inherit global (https).
Host has an additional fallback. If no global host is set, an empty field uses the address from the broker connection URL and shows Auto-detected (...). Setting Host replaces that address in the scrape target advertised during service discovery.
| Field | What it does |
|---|---|
| Scheme | http or https for the scrape URL. An empty value inherits the global scheme. |
| Host | Hostname or IP address Prometheus scrapes. An empty value uses the global or detected host. |
| Port | Exporter port. An empty value inherits the global port. |
| Path | Metrics path, such as /metrics. An empty value inherits the global path. |
- Change only the fields this broker should override.
- Click Save. The platform shows Prometheus settings saved.
- To inherit a field again, clear it and click Save.
These settings do not change how the platform queries Prometheus. They only change the scrape target advertised for this broker during service discovery.
High Performance clusters
For a High Performance cluster, the page shows Cluster defaults first, followed by a section for each node—for example, Node broker-1 (1). Each empty node field inherits the cluster value, which in turn inherits the global value when empty. If no host is set at either level, the node uses the address from its connection URL.